-
Give Me Your Data!
June 4, 2026 / No Comments »
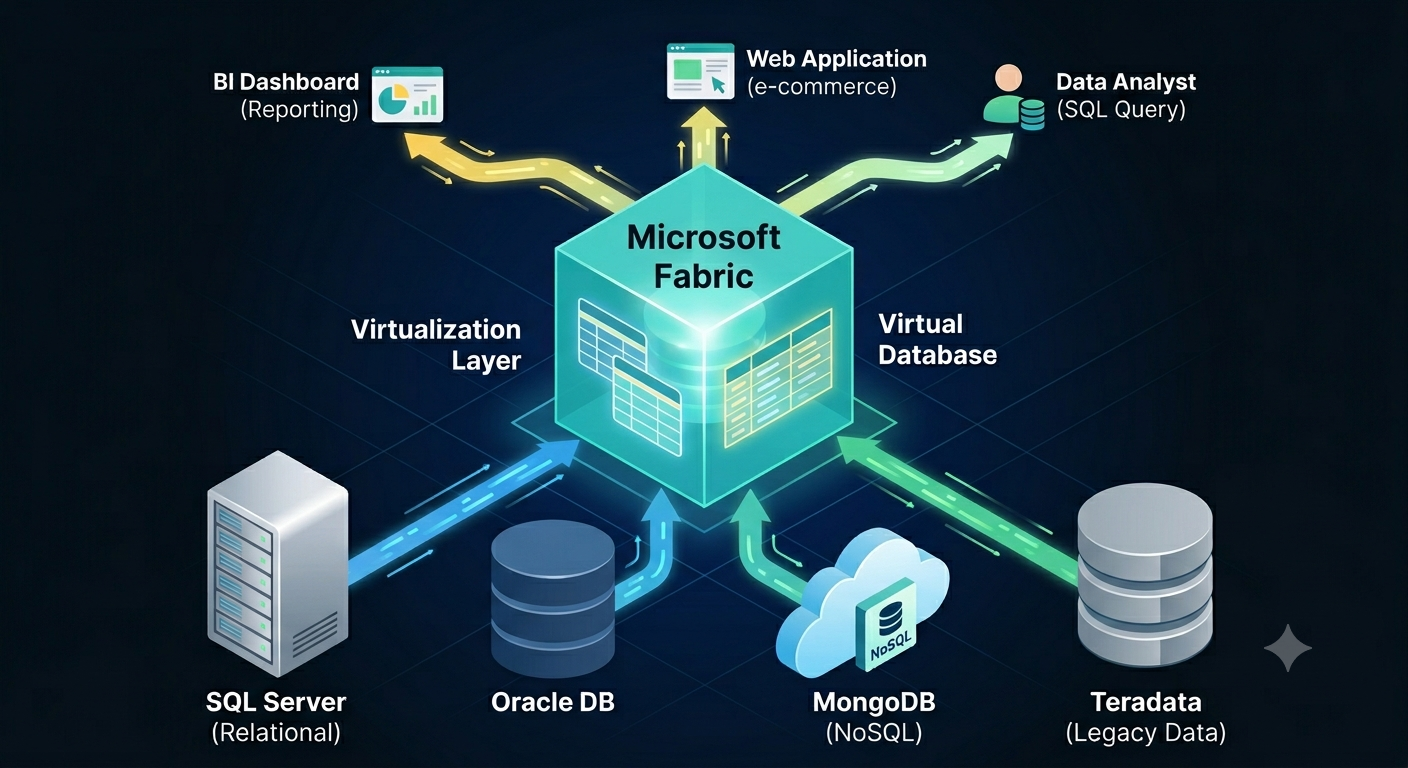
If Microsoft Fabric was the Statue of Liberty, the inscription would be “Give me your data”. Fabric is obsessed with owning the data when it makes sense and when it doesn’t. As I wrote before, this pattern was probably borrowed from Palantir and to align Fabric with the push for “modern” medallion architectures. Or, to establish a permanent dependency on Fabric… Auto-replicating data to Fabric To satisfy the Fabric data appetite and facilitate data ingestion into OneLake, Fabric offers two primary options that don’t require explicit ETL: mirroring and shortcut transformations. Mirroring targets a growing number of relational and non-relational database engines. Although described as “easy-to-use”, mirroring could prove challenging to set up in real life. For example, in one case, the client simply refused to set up mirroring from Google BigQuery because of the requirement to grant excessive permissions. In another case, we are still trying to figure out...
-
Atlanta Microsoft BI Group Meeting on June 1st (Build Your First Agent in Copilot Studio)
May 26, 2026 / No Comments »

Atlanta BI fans, please join us in person for our next meeting on Monday, June 1st at 18:30 ET. Elayne Jones (Senior Solution Engineer at Microsoft) will show you how to build enterprise-ready agents with Copilot Studio. These agents can source data from a variety of data sources including Fabric Data Agents. I will sponsor the meeting. For more details and sign up, visit our group page. Delivery: In-person Level: Intermediate Food: Pizza and drinks will be provided Agenda: 18:15-18:30 Registration and networking 18:30-19:00 Organizer and sponsor time (news, Power BI latest, sponsor marketing) 19:00-20:15 Main presentation 20:15-20:30 Q&A Overview: A practical, hands‑on session for anyone ready to move beyond generic AI chat and start building purpose‑built, enterprise‑ready agents. You’ll learn what agents really are, how they differ from traditional chatbots, and where Copilot Studio fits alongside Microsoft 365 Copilot and Azure AI services. Speaker: Elayne Jones is a Senior Solution Engineer...
-
Replicating BigQuery to Fabric Reloaded
May 20, 2026 / No Comments »

In a previous post, I referred to an engagement where we used the Fabric Copy Job activity to replicate Google BigQuery tables to Fabric, so we can use Direct Lake semantic models. A few months later, the client reported that they pivoted from the Copy Job to notebooks using the Spark BigQuery connector for two main benefits: Much better copy performance – Although the Copy Job would copy tables in parallel, the Spark BigQuery connector reduced significantly the data transfer time. The Copy Job would fully copy all tables in about 40 min. With the Notebook, while the tables run sequentially instead of in parallel, most tables would take between 20-30 sec and one huge 140M fact table takes around 2 minutes to copy fully. Altogether, the required tables take about 20-22 minutes to load, which is almost half the time less than the Copy Job. Upon further research to...
-
Atlanta Microsoft BI Group Meeting on May 4th (Making Sense of Copilot in Power BI)
April 28, 2026 / No Comments »
Atlanta BI fans, please join us in person for our next meeting on Monday, May 4th at 18:30 ET. Jackie Kiadii will show you how you use the Copilot capabilities in Power BI. CloudStaff will sponsor the meeting. For more details and sign up, visit our group page. Delivery: In-person Level: Beginner/Intermediate Food: Pizza and drinks will be provided Agenda: 18:15-18:30 Registration and networking 18:30-19:00 Organizer and sponsor time (news, Power BI latest, sponsor marketing) 19:00-20:15 Main presentation 20:15-20:30 Q&A Overview: Copilot in Power BI is generating excitement — and significant confusion. Between multiple Copilot experiences, Fabric capacity requirements, and differences across Desktop, Service, and Fabric, many Power BI professionals struggle to explain what Copilot actually does and when it makes sense to use it. This session provides a clear, practical overview of: Copilot use cases that exist today Where Copilot works (and where it doesn’t) Licensing and capacity requirements Current limits...
-
Power BI Unmaterialized Columns
April 27, 2026 / No Comments »
Coming back from a long vacation, I’ve almost missed this interesting Power BI enhancement: Power BI unmaterialized calculated columns. Normally, I avoid the traditional DAX calculated columns for a variety of reasons, such as confusion about where business logic is applied, limited support across storage modes (for example, Direct Lake doesn’t support them), longer refresh times, etc. This not to say that calculated columns can't be useful, such as in the case where you need to flatten a parent-child hierarchy. But unmaterialized calculated columns could open interesting scenarios that go beyond content translation to other languages mentioned by Microsoft in the April 2026 update. Understanding unmaterialized columns To start with, the announcement does a good job to confuse the audience by implying that they are applicable only to Direct Lake storage mode. I’ve found the documentation page more useful to understand them (specifically this table). The important takeaway is that...
-
Direct Lake Composite Models
March 4, 2026 / No Comments »
I’ve mentioned previously in the “A Couple of Direct Lake Gotchas” post that unlike Power BI reports, Excel surprised me by not showing user-defined hierarchies in a Direct Lake model. Direct Lake comes with other gotchas, such as not supporting DAX calculated columns and SQL views. I normally don’t use calculated columns, but they can come in handy, such as for flatting a parent-child hierarchies outside ETL. And I like SQL views as an insurance policy for making quick transforms or filters on top of loaded tables to avoid ETL changes. Recently, Microsoft introduced composite Direct Lake models which I demonstrated as a part of a pilot project, mainly to preserve the Excel report experience for financial users. Direct Lake Only vs Composite Direct Lake I view the composite Direct Lake models as the best of both worlds and this table summarizes their characteristics. Direct Lake Only Composite (Direct Lake...
-
Atlanta Microsoft BI Group Meeting on March 2nd (Your First Steps in Microsoft Fabric Using Just SQL)
February 25, 2026 / No Comments »
Atlanta BI fans, please join us in person for our next meeting on Monday, March 2nd at 18:30 ET. Shabnam Watson will show you how you can apply your SQL skills in Microsoft Fabric. And your humble correspondent will walk you through some of the latest Power BI and Fabric enhancements. I will sponsor the meeting. For more details and sign up, visit our group page. Delivery: In-person Level: Beginner/Intermediate Food: Pizza and drinks will be provided Agenda: 18:15-18:30 Registration and networking 18:30-19:00 Organizer and sponsor time (news, Power BI latest, sponsor marketing) 19:00-20:15 Main presentation 20:15-20:30 Q&A Overview: New to Microsoft Fabric? Don’t worry—you already know more than you think. In this beginner-friendly session, we’ll explore how your existing SQL skills translate directly into Fabric without needing to learn Spark, Python, or unfamiliar engineering tools. You’ll see how SQL can be applied across Fabric items to explore, shape, and analyze data...
-
A Couple of Direct Lake Gotchas
February 24, 2026 / No Comments »
I’m helping an enterprise client modernize their data analytics estate. As a part of this exercise, a SSAS Multidimensional financial cube must be converted to a Power BI semantic model. The challenge is that business users ask for almost real-time BI during the forecasting period, where a change in the source forecasting system must be quickly propagated to the reporting the layer, so the users don’t sit around waiting to analyze the impact. An important part of this architecture is the Fabric Direct Lake storage to eliminate the refresh latency, but it came up with a couple of gotchas. Performance issues with calculated accounts Financial MD cubes are notoriously difficult to convert to Tabular/Power BI because of advanced features that aren’t supported in the new world, such as Account Intelligence, scope assignments, parent-child hierarchies, and calculated dimension members. The latter presented a performance challenge. Consider the following MDX construct: CREATE...
-
Atlanta Microsoft BI Group Meeting on February 2nd (Power BI Translytical Taskflows)
January 28, 2026 / No Comments »
Atlanta BI fans, please join us in person for our next meeting on Monday, February 2nd at 18:30 ET. Sukhwant Kaur (Product Manager at Microsoft) will show you how supercharge your Power BI reports with translytical taskflows. And your humble correspondent will walk you through some of the latest Power BI and Fabric enhancements. CloudStaff.au will sponsor the meeting. For more details and sign up, visit our group page. Delivery: In-person Level: Beginner/Intermediate Food: Pizza and drinks will be provided Agenda: 18:15-18:30 Registration and networking 18:30-19:00 Organizer and sponsor time (news, Power BI latest, sponsor marketing) 19:00-20:15 Main presentation 20:15-20:30 Q&A Overview: Join us for an engaging session exploring how to build powerful translytical applications using Power BI, Functions, and SQL Database within Microsoft Fabric. We'll discuss best practices for integrating analytics and transactional workloads, demonstrate real-world use cases, and provide actionable tips for leveraging Fabric’s unified platform. This talk is ideal...
-
Power BI Dynamic Measure Tooltip
December 31, 2025 / No Comments »
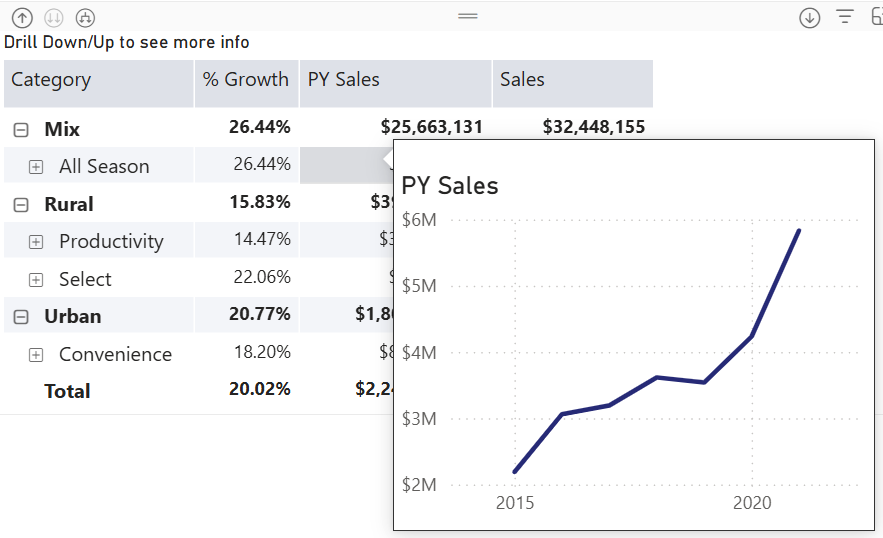
Happy New Year with oldies but goodies…especially given that this technique might be hard to find elsewhere! How do you implement a tooltip page that shows only the measure the end user hovers over? Consider this matrix with three measures on columns grouped by product categories on rows. The user wants to see a trend chart for the measure they hover over. Understanding the challenge Power BI has long supported custom tooltip pages. Passing member context, such as the selected product category, is not an issue. However, passing the selected measure won’t work without some blackbelt magic because measures are not field members. And so, we will have to turn the measures used in the matrix in a dimension. Then, instead of adding measures to the matrix as you would typically do, you would use the dimension. You can probably follow a similar implementation approach using Power BI field parameters,...
Training
 We offer onsite and online Business Intelligence classes! Contact us about in-person training for groups of five or more students.
For more information or to register click here!
Books
 Learn Power BI at your own pace with our latest book Applied Microsoft Power BI. Targeting information workers, data analysts, pros, and developers, It is designed as an easy-to-follow guide for learning how to implement BI solutions spanning the entire personal-team-organizational BI spectrum.

